![[Experimental]](figures/lifecycle-experimental.svg)
plot_word_frequency() plots word frequencies charts related to an output of
word_frequency().
plot_word_frequency(
  data,
  min_freq = 1,
  max_words = 10,
  dist = FALSE,
  color = viridis::viridis(1)
)
Arguments
- data
A
tibbleobject with two columns:word(with an unique set of words) andfreq(with the absolute frequency of a word inword). Useword_frequency()to generate this value.- min_freq
(optional) a number indicating the minimum frequency that a word can have to be plotted (default:
1).- max_words
(optional) a number indicating the maximum number of words to be plotted (default:
100).- dist
(optional) a
logicalvalue indicating if the function must plot a frequency versus range chart for visualizing the whole distribution (default:FALSE).- color
(optional) a string with a Hex color code indicating the color of the data (default:
viridis::viridis(1)).
Value
An invisible NULL. This function don't aim to return values.
See also
Other Plot functions:
plot_wordcloud()
Examples
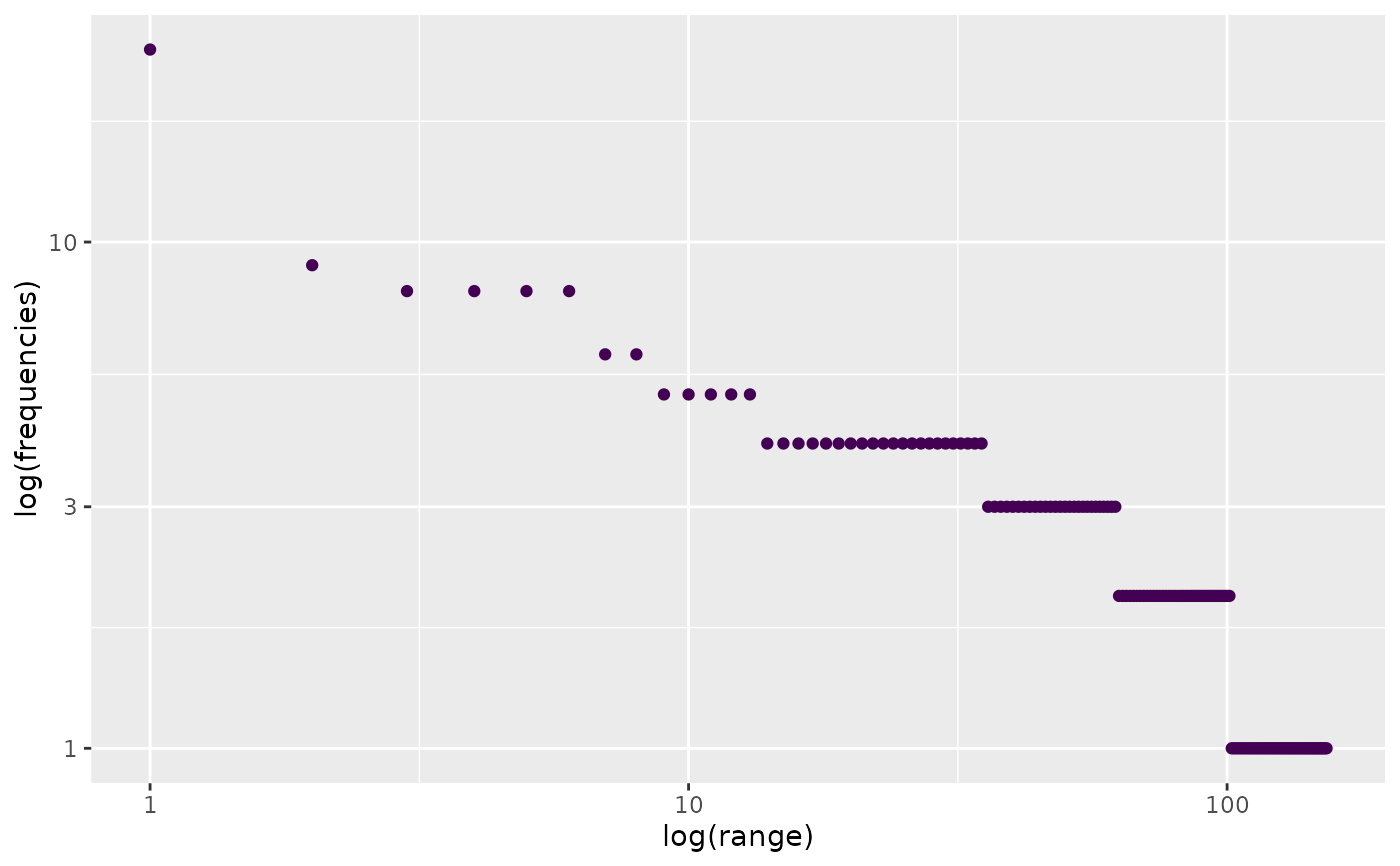
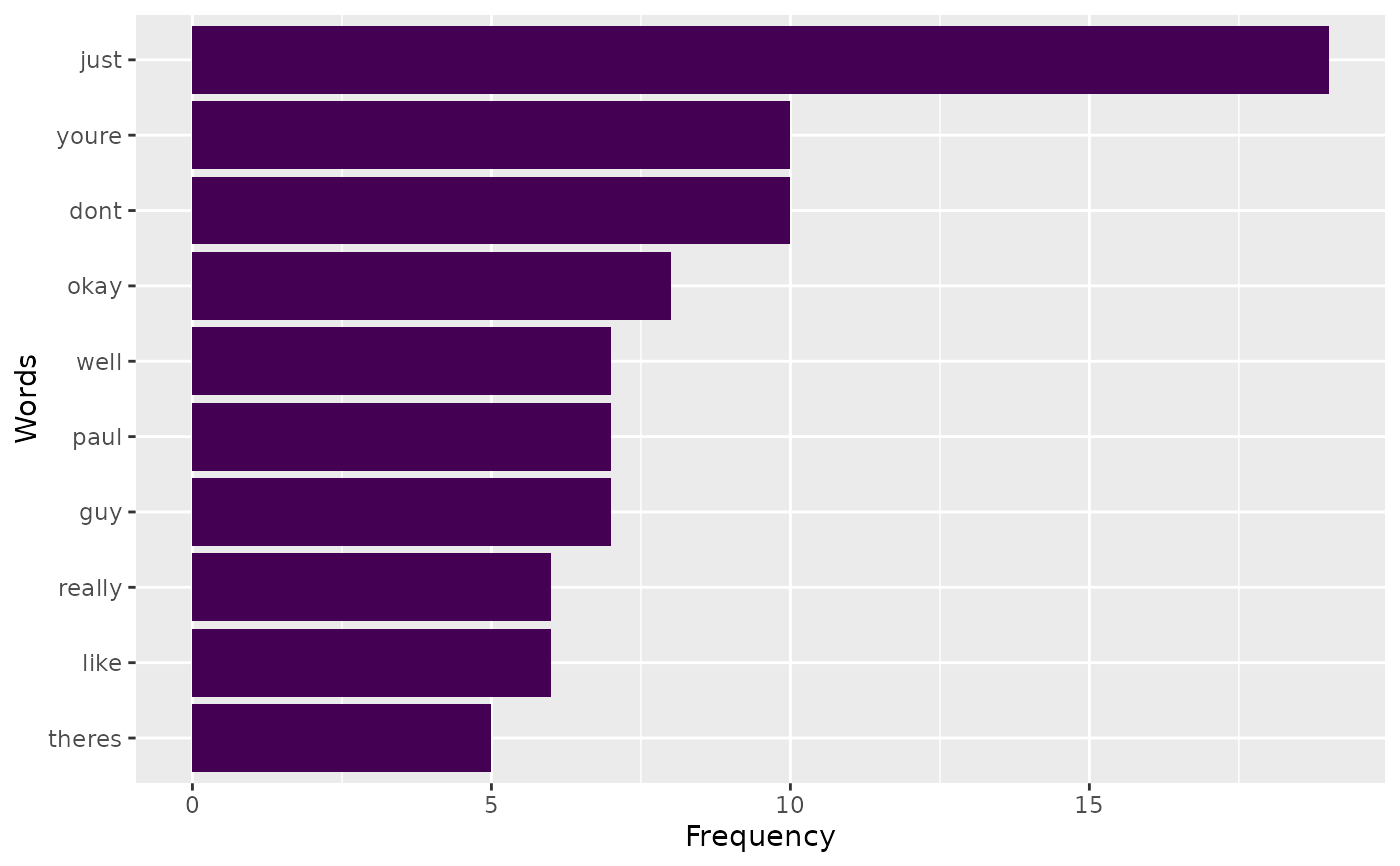
if (requireNamespace("friends", quietly = TRUE)) {
data <- word_frequency(head(friends::friends[[1]], 100))
plot_word_frequency(data)
suppressMessages(plot_word_frequency(data, dist = TRUE))
## Note that graphics rendered in the documentation may
## not represent the quality of the output.
}
 #>
#>
#>
#>
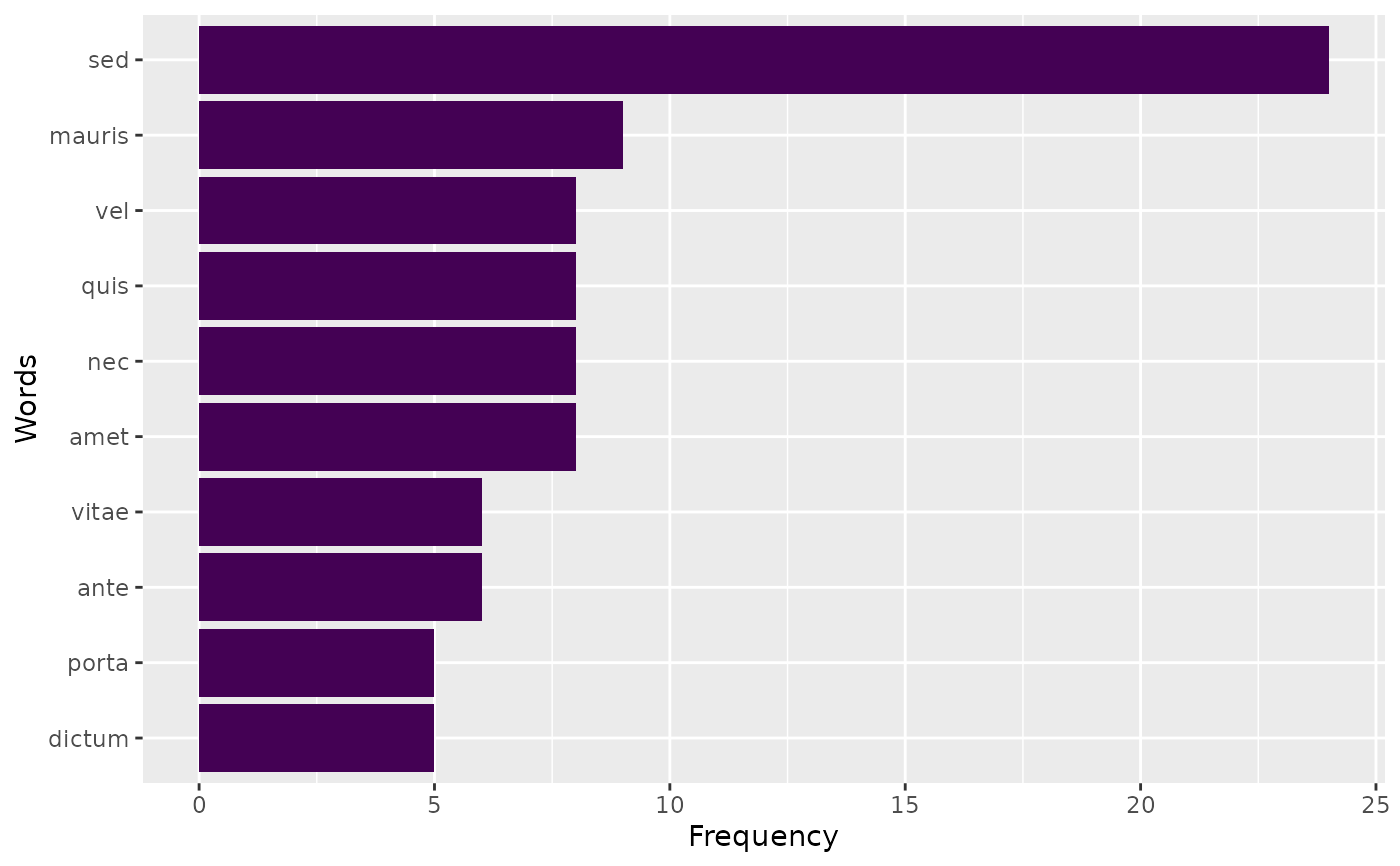
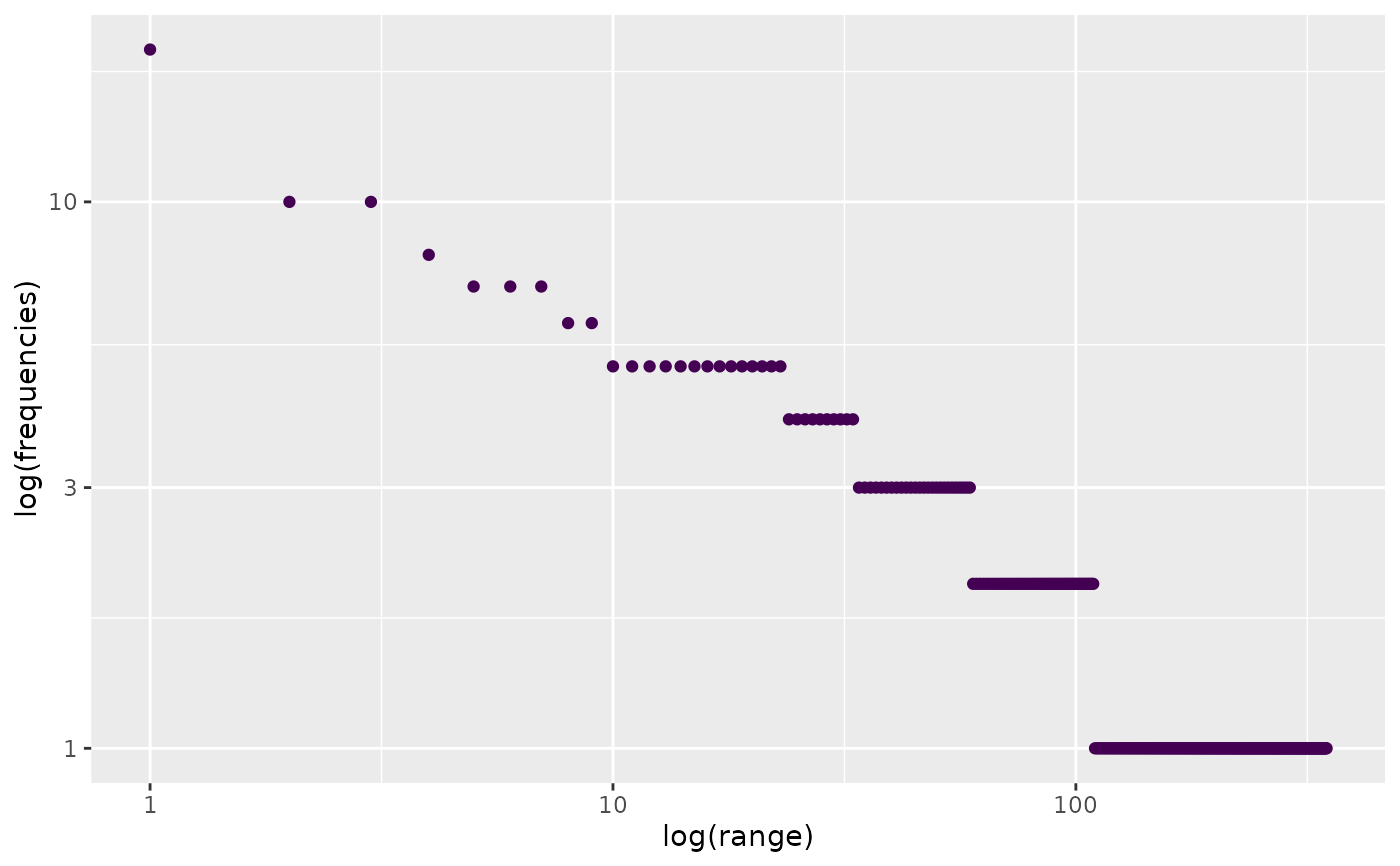 if (requireNamespace("stringi", quietly = TRUE)) {
data <- word_frequency(stringi::stri_rand_lipsum(5))
plot_word_frequency(data)
suppressMessages(plot_word_frequency(data, dist = TRUE))
## Note that graphics rendered in the documentation may
## not represent the quality of the output.
}
if (requireNamespace("stringi", quietly = TRUE)) {
data <- word_frequency(stringi::stri_rand_lipsum(5))
plot_word_frequency(data)
suppressMessages(plot_word_frequency(data, dist = TRUE))
## Note that graphics rendered in the documentation may
## not represent the quality of the output.
}
 #>
#>
#>
#>