scale_*_brand_*() functions provide color scales for
ggplot2 based on brand colors defined
in the _brand.yml file. These functions create discrete, continuous, or
binned scales with sequential, diverging, or qualitative color palettes
that match your brand identity.
Usage
scale_brand(
  aesthetics = "color",
  scale_type = "c",
  color_type = "seq",
  alpha = NULL,
  direction = 1,
  na.value = NA,
  reverse = FALSE,
  ...
)

scale_color_brand_d(
  aesthetics = "color",
  scale_type = "d",
  color_type = "qual",
  alpha = NULL,
  direction = 1,
  na.value = NA,
  reverse = FALSE,
  ...
)

scale_color_brand_c(
  aesthetics = "color",
  scale_type = "c",
  color_type = "seq",
  alpha = NULL,
  direction = 1,
  na.value = NA,
  reverse = FALSE,
  ...
)

scale_color_brand_b(
  aesthetics = "color",
  scale_type = "b",
  color_type = "seq",
  alpha = NULL,
  direction = 1,
  na.value = NA,
  reverse = FALSE,
  ...
)

scale_colour_brand_d(
  aesthetics = "color",
  scale_type = "d",
  color_type = "qual",
  alpha = NULL,
  direction = 1,
  na.value = NA,
  reverse = FALSE,
  ...
)

scale_colour_brand_c(
  aesthetics = "color",
  scale_type = "c",
  color_type = "seq",
  alpha = NULL,
  direction = 1,
  na.value = NA,
  reverse = FALSE,
  ...
)

scale_colour_brand_b(
  aesthetics = "color",
  scale_type = "b",
  color_type = "seq",
  alpha = NULL,
  direction = 1,
  na.value = NA,
  reverse = FALSE,
  ...
)

scale_fill_brand_d(
  aesthetics = "fill",
  scale_type = "d",
  color_type = "qual",
  alpha = NULL,
  direction = 1,
  na.value = NA,
  reverse = FALSE,
  ...
)

scale_fill_brand_c(
  aesthetics = "fill",
  scale_type = "c",
  color_type = "seq",
  alpha = NULL,
  direction = 1,
  na.value = NA,
  reverse = FALSE,
  ...
)

scale_fill_brand_b(
  aesthetics = "fill",
  scale_type = "b",
  color_type = "seq",
  alpha = NULL,
  direction = 1,
  na.value = NA,
  reverse = FALSE,
  ...
)
Arguments
- aesthetics
(Optional) A
characterstring indicating the name of the aesthetic of the scale (e.g.,"color","fill") (Default:"color").- scale_type
(Optional) A
characterstring indicating the type of scale:"d"/"discrete","c"/"continuous", or"b"/"binned"(Default:"c").- color_type
(Optional) A
characterstring indicating the type of color scale:"seq"/"sequential","div"/"diverging", or"qual"/"qualitative"(Default:"seq").- alpha
(Optional) A number between
0and1, indicating the transparency of the colors (Default:NULL).- direction
(Optional) A number (
1or-1) indicating the direction of the colors. If1, the order remains the same. If-1, the order is reversed. (Default:1).- na.value
(Optional) A
characterstring indicating the color to use for missing values. It must contain a hexadecimal color code or one of the values output bycolors()(Default:NA).- reverse
(Optional) A
logicalflag indicating whether the legend or color bar should be reversed (Default:FALSE).- ...
Additional arguments passed to the
ggplot2scale function:discrete_scale(),continuous_scale(), orbinned_scale().
Value
A ggplot2 scale object.
Details
Path to _brand.yml
brandr will always look for a _brand.yml file in the root directory of
your project. If the file is not found, an error message will be displayed.
You can also set the path to the file manually using the
options() function:
options(BRANDR_BRAND_YML = "PATH_TO_BRAND.YML")Brand Color Scales
To control the colors for each brand color scale, assign the desired
hexadecimal color codes in a
character vector to the following options:
BRANDR_COLOR_SEQUENTIAL: For sequential color scalesBRANDR_COLOR_DIVERGING: For diverging color scalesBRANDR_COLOR_QUALITATIVE: For qualitative color scales
You can use get_brand_color() to get the hexadecimal
color codes from the _brand.yml file.
Example:
options(
  BRANDR_COLOR_SEQUENTIAL =
    get_brand_color(c("primary", "secondary")),
  BRANDR_COLOR_DIVERGING =
    get_brand_color(c("primary", "white", "secondary")),
  BRANDR_COLOR_QUALITATIVE =
    get_brand_color(c("primary", "secondary", "tertiary"))
)
Examples
if (requireNamespace(
c("palmerpenguins", "tidyr", "ggplot2"),
quiet = TRUE
)
) {
library(ggplot2)
library(palmerpenguins)
library(tidyr)
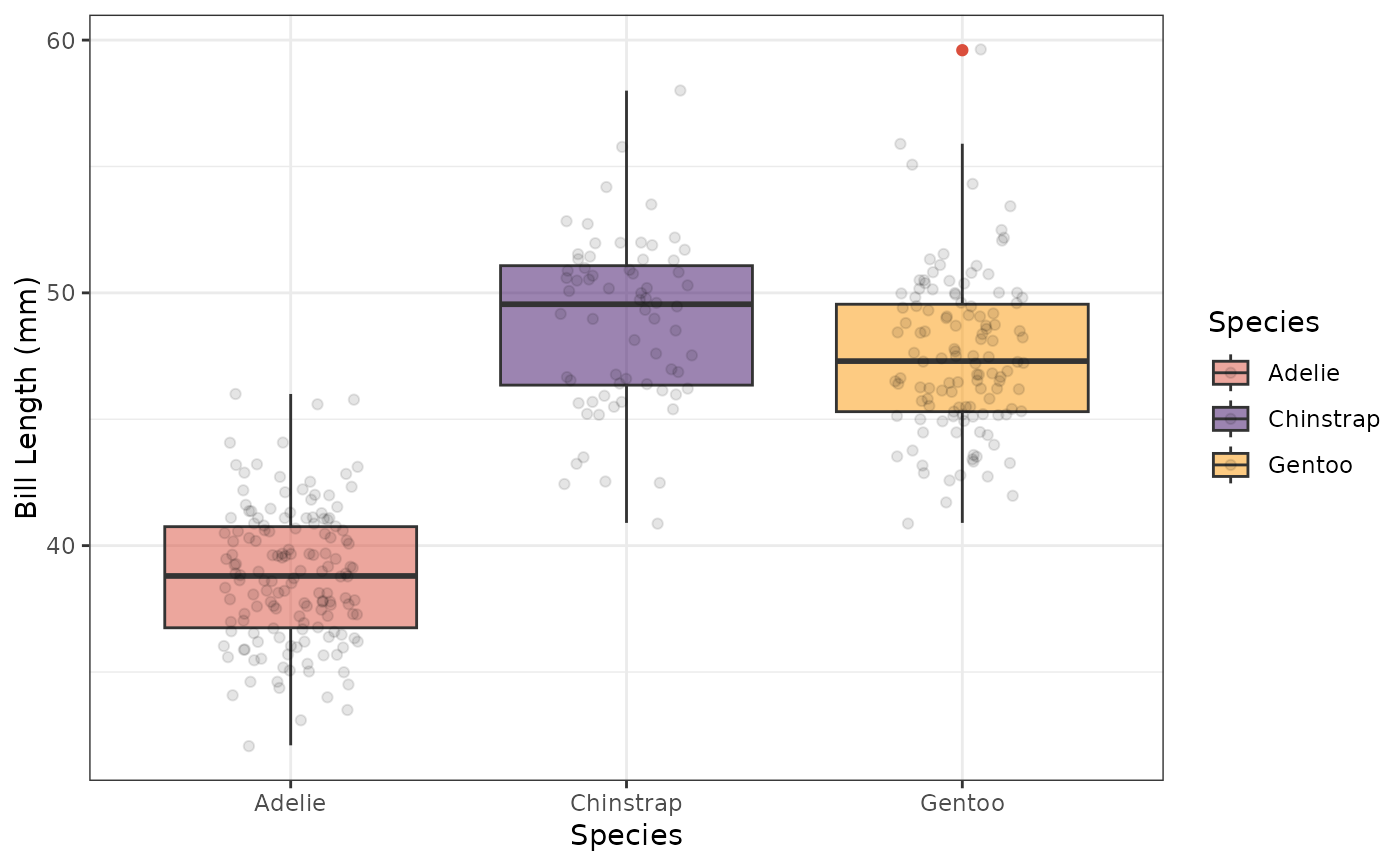
penguins |>
drop_na(bill_length_mm, species) |>
ggplot(aes(x = species, y = bill_length_mm, fill = species)) +
geom_boxplot(outlier.color = get_brand_color("red")) +
geom_jitter(width = 0.2, alpha = 0.1) +
scale_fill_brand_d(alpha = 0.5) +
labs(
x = "Species",
y = "Bill Length (mm)",
fill = "Species"
) +
theme_bw()
}
#>
#> Attaching package: ‘palmerpenguins’
#> The following objects are masked from ‘package:datasets’:
#>
#> penguins, penguins_raw
 if (requireNamespace(
c("palmerpenguins", "tidyr", "ggplot2"),
quiet = TRUE
)
) {
library(ggplot2)
library(palmerpenguins)
library(tidyr)
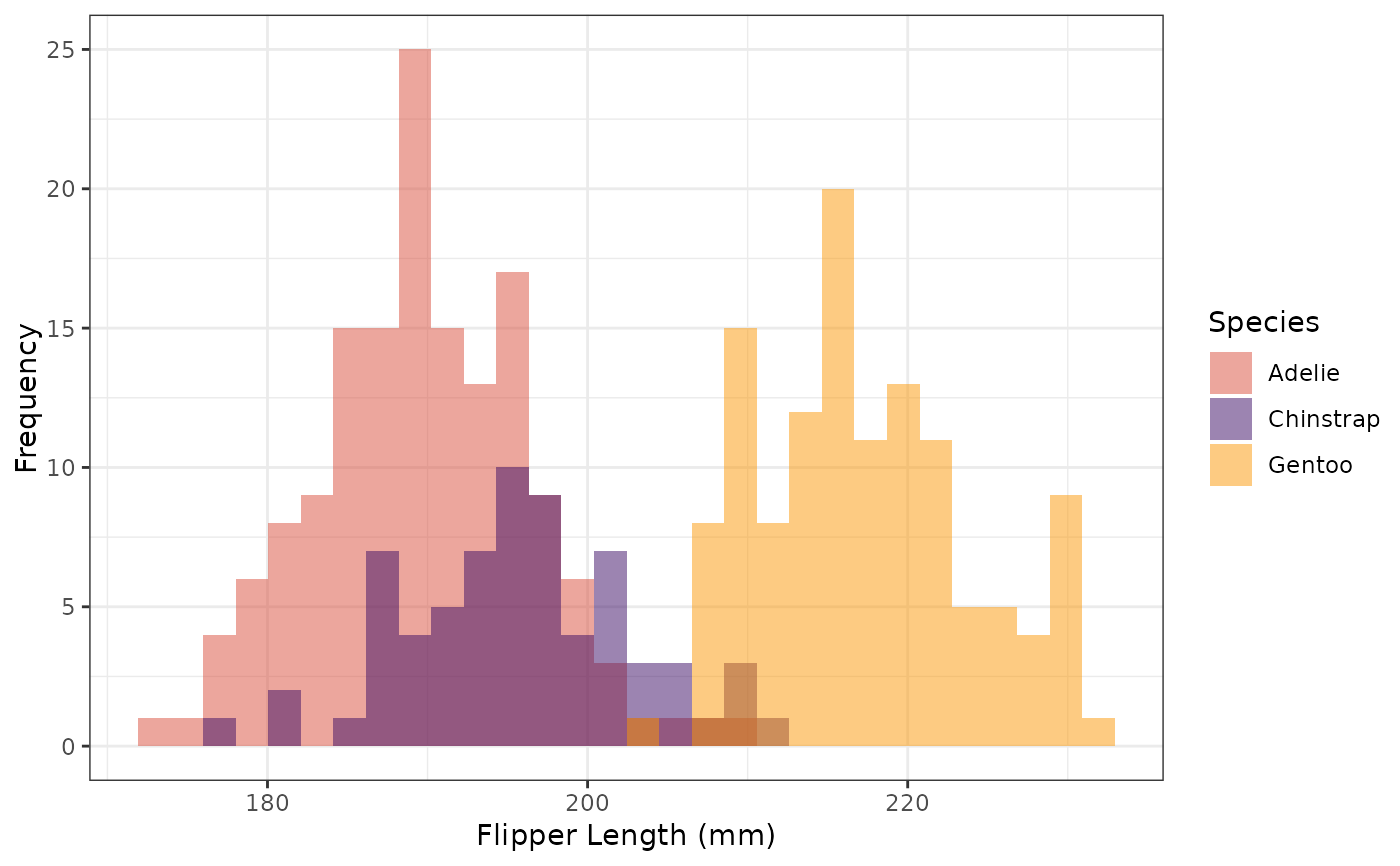
penguins |>
drop_na(flipper_length_mm, species) |>
ggplot(aes(x = flipper_length_mm, fill = species)) +
geom_histogram(alpha = 0.5, bins = 30, position = "identity") +
scale_fill_brand_d() +
labs(
x = "Flipper Length (mm)",
y = "Frequency",
fill = "Species"
) +
theme_bw()
}
if (requireNamespace(
c("palmerpenguins", "tidyr", "ggplot2"),
quiet = TRUE
)
) {
library(ggplot2)
library(palmerpenguins)
library(tidyr)
penguins |>
drop_na(flipper_length_mm, species) |>
ggplot(aes(x = flipper_length_mm, fill = species)) +
geom_histogram(alpha = 0.5, bins = 30, position = "identity") +
scale_fill_brand_d() +
labs(
x = "Flipper Length (mm)",
y = "Frequency",
fill = "Species"
) +
theme_bw()
}
 if (requireNamespace(
c("palmerpenguins", "tidyr", "ggplot2"),
quiet = TRUE
)
) {
library(ggplot2)
library(palmerpenguins)
library(tidyr)
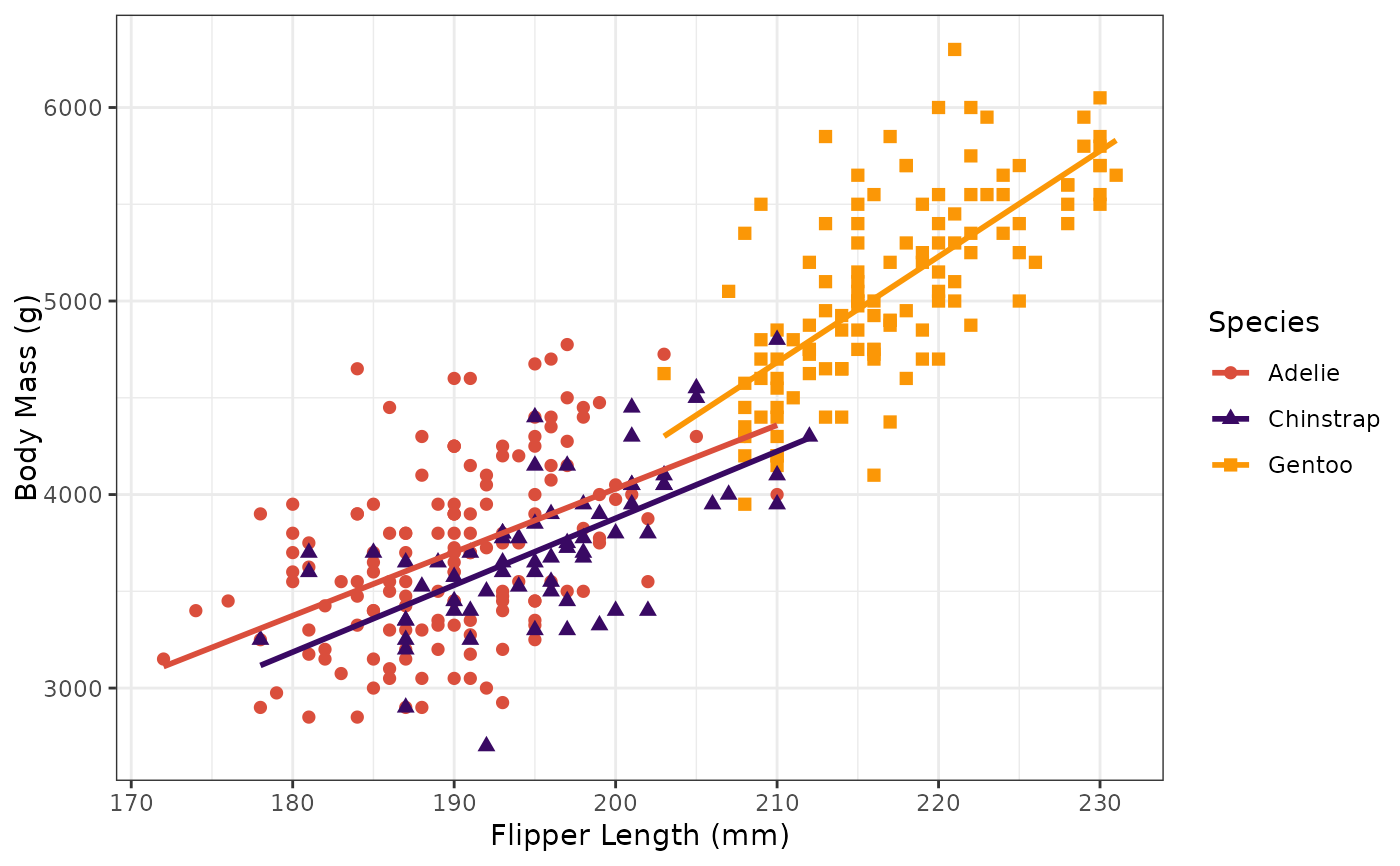
penguins |>
drop_na(flipper_length_mm, body_mass_g, species) |>
ggplot(
aes(
x = flipper_length_mm,
y = body_mass_g,
color = species,
shape = species
)
) +
geom_point(size = 2) +
geom_smooth(method = "lm", formula = y ~ x, se = FALSE) +
scale_color_brand_d() +
labs(
x = "Flipper Length (mm)",
y = "Body Mass (g)",
color = "Species",
shape = "Species"
) +
theme_bw()
}
if (requireNamespace(
c("palmerpenguins", "tidyr", "ggplot2"),
quiet = TRUE
)
) {
library(ggplot2)
library(palmerpenguins)
library(tidyr)
penguins |>
drop_na(flipper_length_mm, body_mass_g, species) |>
ggplot(
aes(
x = flipper_length_mm,
y = body_mass_g,
color = species,
shape = species
)
) +
geom_point(size = 2) +
geom_smooth(method = "lm", formula = y ~ x, se = FALSE) +
scale_color_brand_d() +
labs(
x = "Flipper Length (mm)",
y = "Body Mass (g)",
color = "Species",
shape = "Species"
) +
theme_bw()
}
 if (requireNamespace("ggplot2", quiet = TRUE)) {
library(ggplot2)
faithfuld |>
ggplot(aes(waiting, eruptions, fill = density)) +
geom_raster() +
scale_fill_brand_b() +
labs(
x = "Waiting Time to Next Eruption (min)",
y = "Eruption Time (min)",
fill = "Density"
) +
theme_bw()
}
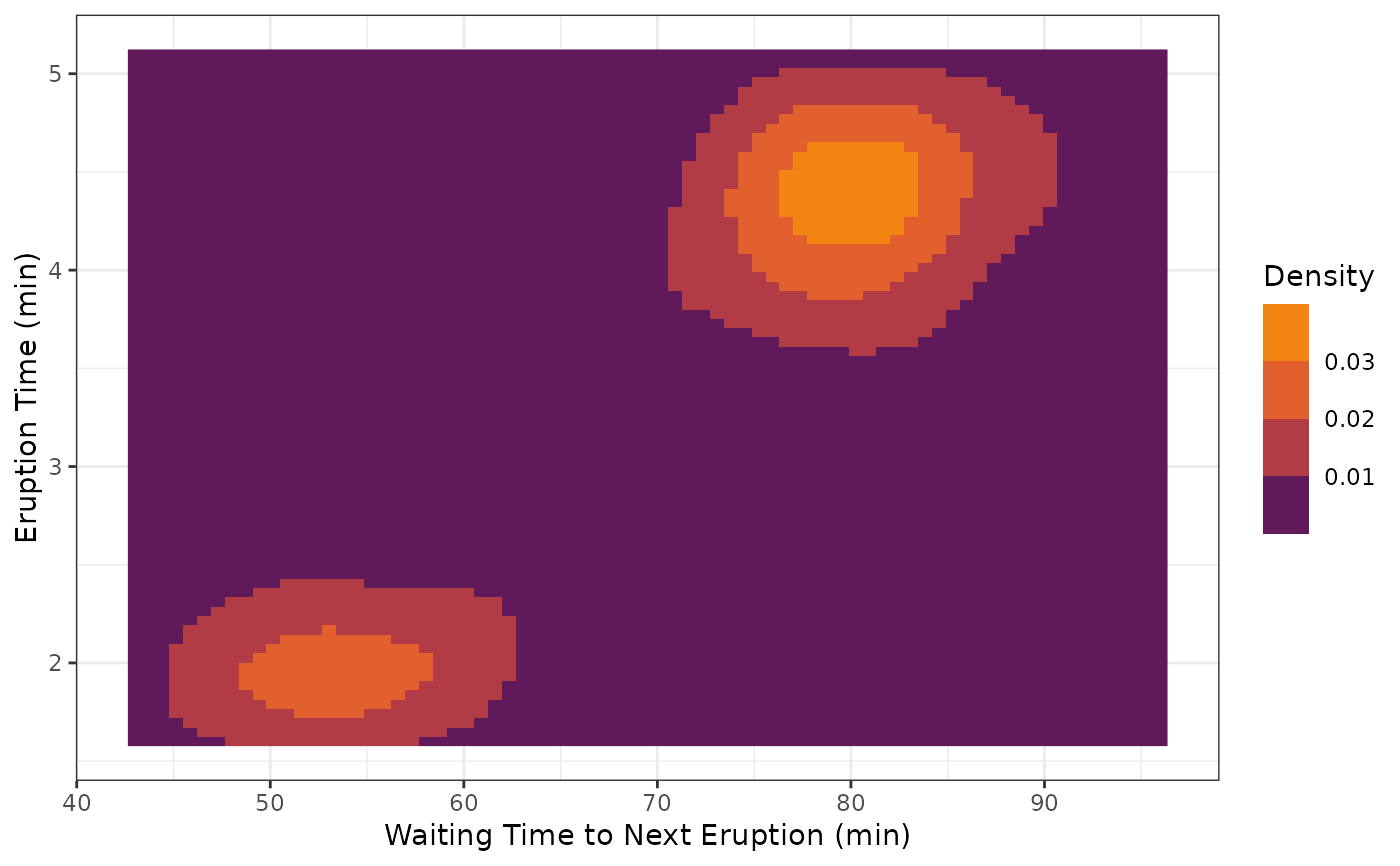
if (requireNamespace("ggplot2", quiet = TRUE)) {
library(ggplot2)
faithfuld |>
ggplot(aes(waiting, eruptions, fill = density)) +
geom_raster() +
scale_fill_brand_b() +
labs(
x = "Waiting Time to Next Eruption (min)",
y = "Eruption Time (min)",
fill = "Density"
) +
theme_bw()
}
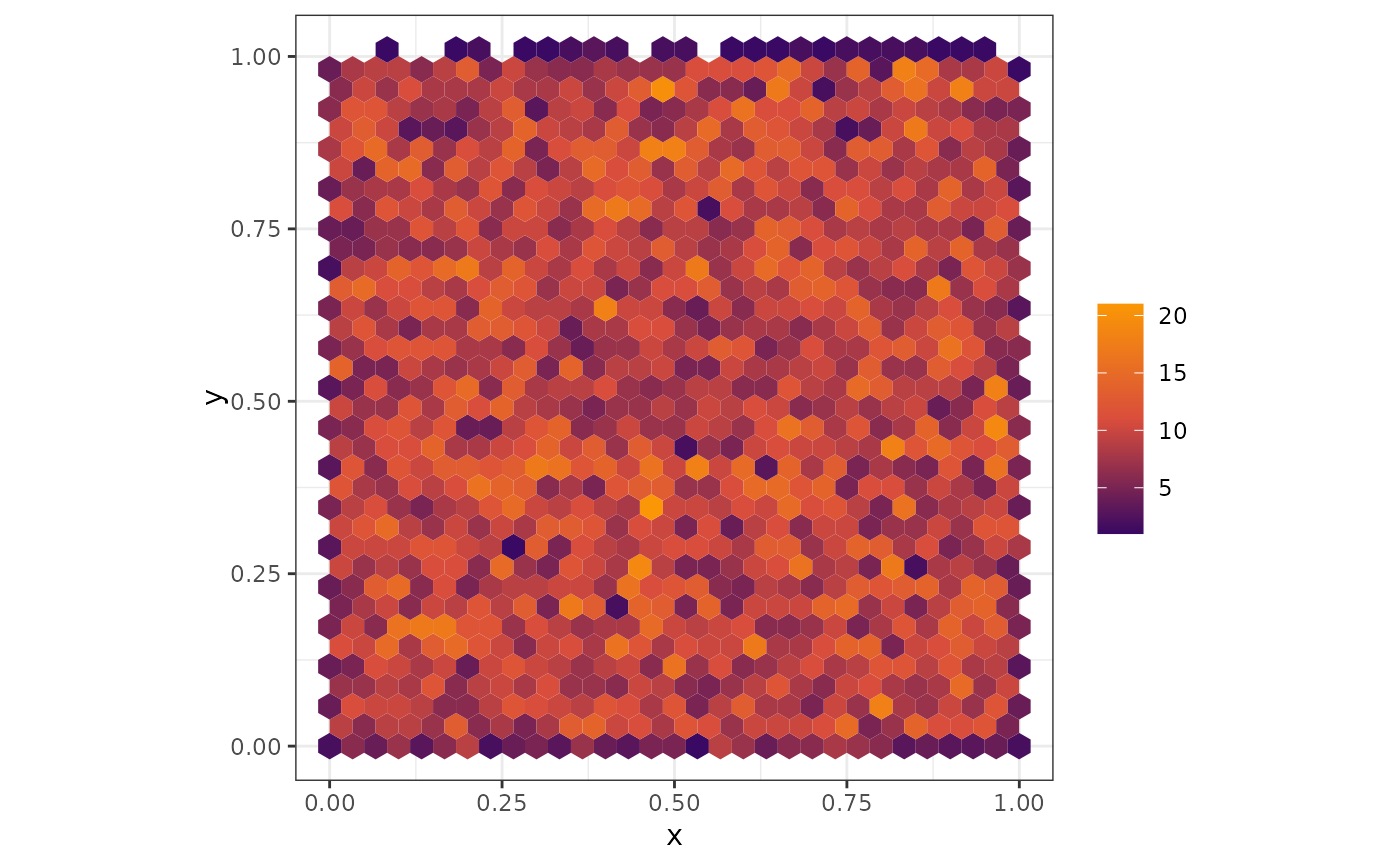
 if (requireNamespace("ggplot2", quiet = TRUE)) {
library(ggplot2)
library(hexbin)
data.frame(x = runif(10000), y = runif(10000)) |>
ggplot(aes(x, y)) +
geom_hex() +
coord_fixed() +
scale_fill_brand_c() +
labs(fill = "") +
theme_bw()
}
if (requireNamespace("ggplot2", quiet = TRUE)) {
library(ggplot2)
library(hexbin)
data.frame(x = runif(10000), y = runif(10000)) |>
ggplot(aes(x, y)) +
geom_hex() +
coord_fixed() +
scale_fill_brand_c() +
labs(fill = "") +
theme_bw()
}